In today’s enterprise, performance is revenue, and downtime is a headline risk. Yet as systems scale across clouds, regions and tools the visibility lags. That’s where modern observability steps in. Enterprises increasingly rely on complex, distributed systems, yet lack full visibility into how services behave across environments. When things go wrong, delays in diagnosis and recovery can be costly, both financially and reputationally. We at Deliqt have built a turnkey Observability-as-a-Service platform that helps enterprises move from fragmented monitoring to cohesive, actionable insights.
Read along as we explain how we help you get there securely, swiftly and sustainably.
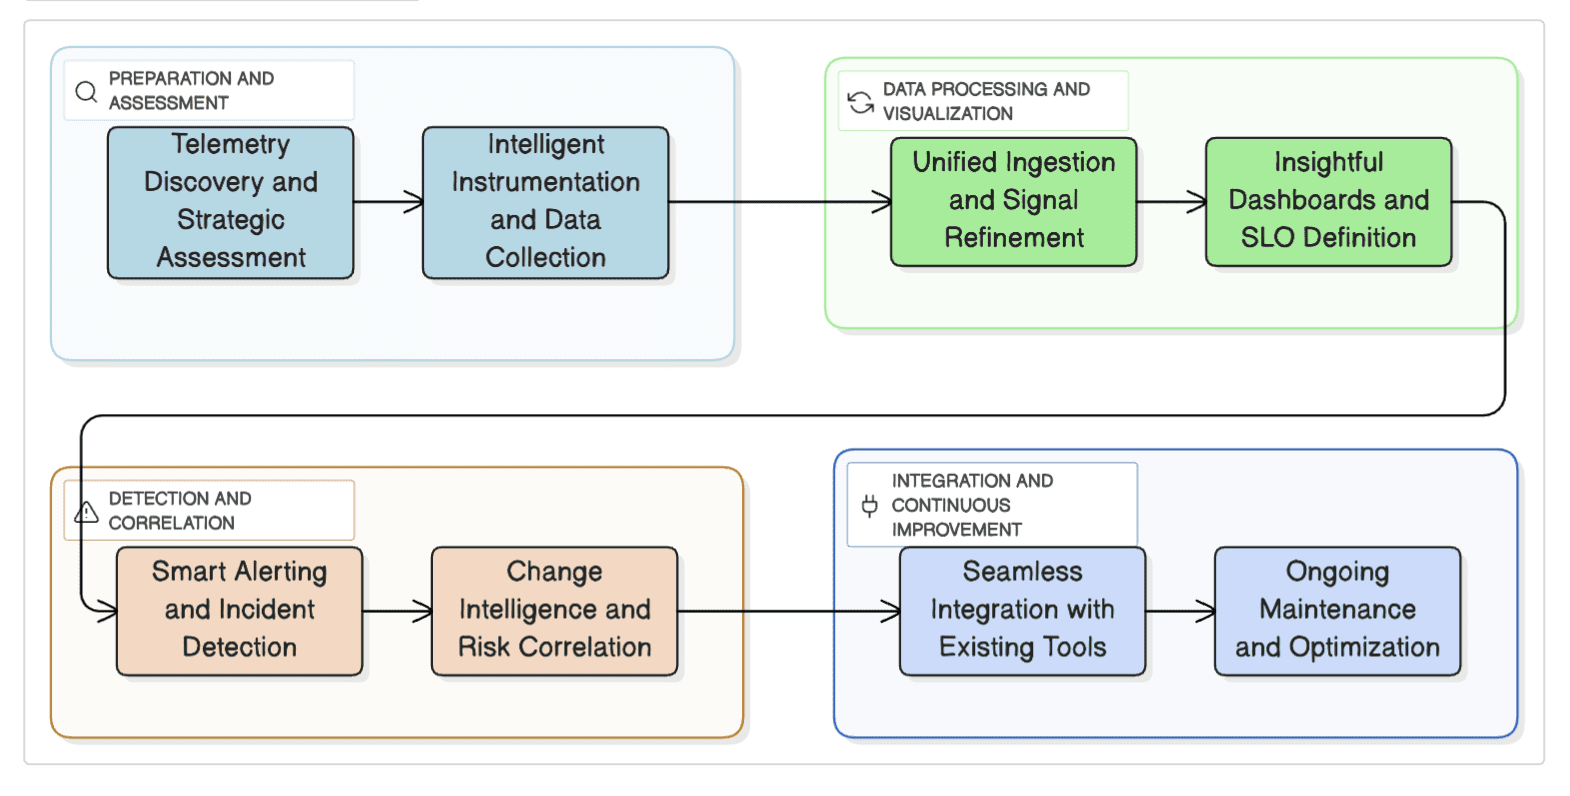
Step 1: Telemetry Discovery & Strategic Assessment
Our journey begins with deep discovery. We collaborate with your infrastructure, security and application teams to map out the full telemetry landscape, understanding what metrics, logs, traces and events currently exist and what’s missing.
We don’t stop at technical integration, we assess telemetry maturity, noise-to-signal ratio and how observability ties back to your business KPIs. This step helps shape a tailored architecture that aligns with your operational goals and risk posture.
Step 2: Intelligent Instrumentation & Data Collection
Once we have a blueprint, we deploy instrumentation across your infrastructure. Whether it’s microservices in Kubernetes, legacy applications, edge devices or hybrid networks, we implement lightweight agents and SDKs using open standards like OpenTelemetry and Fluent Bit.
The goal is zero disruption. We prioritize minimal performance overhead while capturing high-value signals like transactional latency, error rates, authentication trails and system health metrics. This data becomes the foundation of your observability.
Step 3: Unified Ingestion & Signal Refinement
Enterprises generate vast telemetry but more data doesn’t mean more clarity. We engineer ingestion pipelines that clean, reshape and prioritize signals before they hit storage. This ensures only relevant, correlated data is kept while cutting noise and reducing cost.
Our system intelligently deduplicates events, aggregates metrics where appropriate and flags unusual behavior in real time. Logs, traces and metrics aren’t siloed, they’re interconnected, creating a living, breathing map of your system behavior.
Step 4: Insightful Dashboards & SLO Definition
Your leadership doesn’t need charts they need context. We build dashboards that go beyond raw metrics, surfacing the health of critical business functions using service-level objectives (SLOs).
Whether it’s “API response latency under 200ms” or “network packet loss below 0.5%,” we map technical indicators to business impact.
The result? Executives, developers and operations teams finally speak the same language i.e. reliability.
Step 5: Smart Alerting & Incident Detection
Our alerting philosophy is simple. Alert less, mean more. We implement a context-aware alerting system that flags issues based on threshold breaches, anomalies and behavioral changes across time, location or user segment.
Each alert includes rich context, including traces of affected requests, system metadata and potential root causes. This enables your teams to act fast and reduce mean time to resolution (MTTR). No more alert fatigue, just signal when it matters.
Step 6: Change Intelligence & Risk Correlation
Modern systems change rapidly, but observability often lags behind. We integrate observability with your CI/CD pipelines, infrastructure-as-code and change management workflows. When a deployment, firewall rule update, DNS change etc. coincides with a service dip, we flag it instantly.
Security teams also benefit. Anomalous spikes in logs or latencies linked to identity providers or external connections can signal potential breaches or misconfigurations. Thus giving your CSO’s team early detection without adding more tools.
Step 7: Seamless Integration with Your Existing Ecosystem
You have most probably invested in tools like Grafana, Splunk, DataDog, ServiceNow, PagerDuty etc. We don’t aim to replace them. We integrate into your current ecosystem through standards-compliant APIs, dashboards and alert channels.
From pulling metrics into your enterprise dashboard to feeding SLO data to compliance engines, we make observability an enabler, not another silo.
Step 8: Ongoing Maintenance & Optimization
After the setup, we don’t walk away. Our ongoing maintenance service ensures your observability stack stays lean, effective and aligned with evolving architecture.
We keep tuning noisy alerts, add new service telemetry, manage cardinality explosion and cost drift to keep your visibility sharp and your systems reliable.
And with quarterly reviews, your leadership stays informed on uptime trends, coverage and operational efficiency.
Why Choose Us
Tailored, Not Templated: We don’t offer one-size-fits-all solutions. Every engagement is bespoke, designed around your specific infrastructure, priorities and compliance needs.
Secure by Design: From day one, we bake in security with zero-trust agents, secure data transit, RBAC-controlled dashboards and no third-party vendor lock-in.
Intelligence Without Noise: Smart signal refinement means your teams see issues before they escalate without being buried in irrelevant data.
Built to Integrate: We don’t ask you to rip and replace. We extend your existing tools, workflows and dashboards, making integration seamless.
Partnership, Not a Product: We’re not selling software. We’re building long-term reliability with you. As your systems evolve, so do we.
Observability isn’t a tool—it’s a business capability.
We help you see what’s happening, why it’s happening, and what to do next. With uptime you can count on, and insight your teams can act on.
Ready to bring clarity, control, and confidence to your infrastructure? Let’s talk.
Whether you’re just starting your observability journey or looking to optimize what you have, Deliqt can help you modernize with purpose. Let’s connect and explore how we can build reliable, resilient systems together.